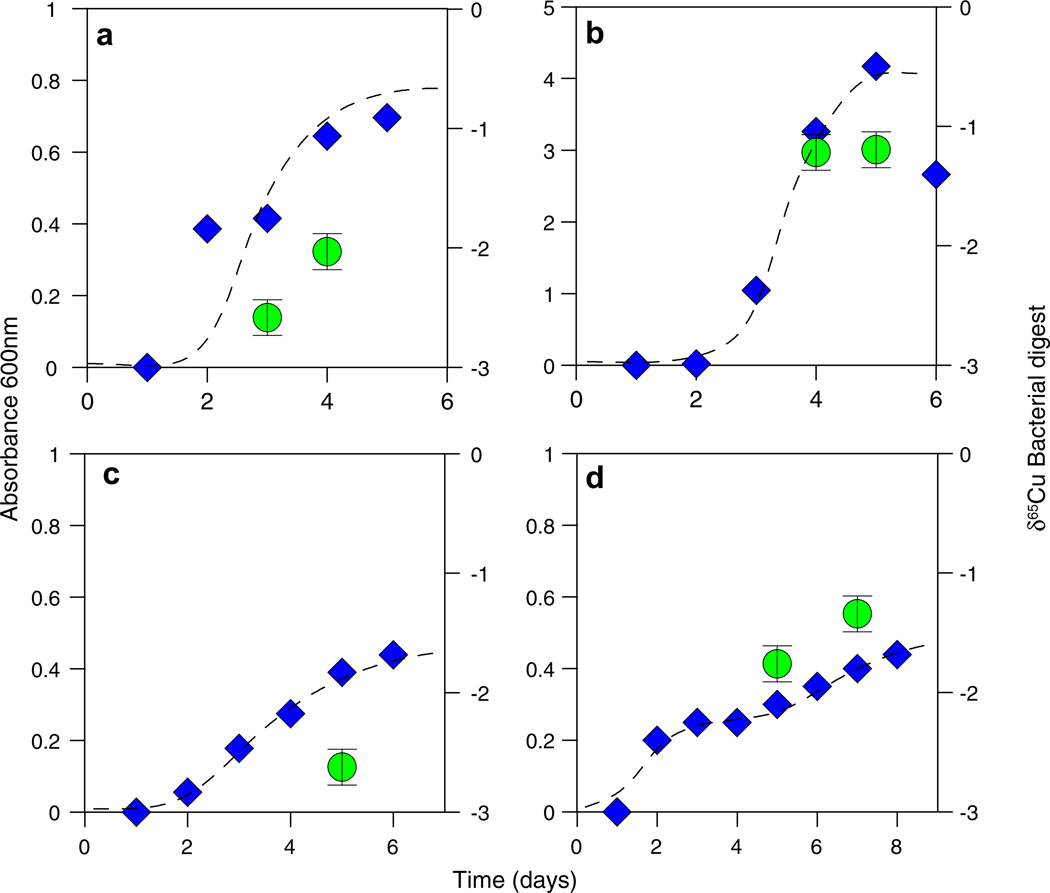
Fig. 10.
Absorbance at 600 nm (blue diamonds) and δ65Cu (green circles) data plotted as a function of time for intracellular incorporation experiments with (a) E. coli, (b) B. subtilis, (c) RGR consortium, and (d) CC consortium. Growth behavior is illustrated by dashed curves. (For interpretation of the references to color in this figure legend, the reader is referred to the web version of this article.)

