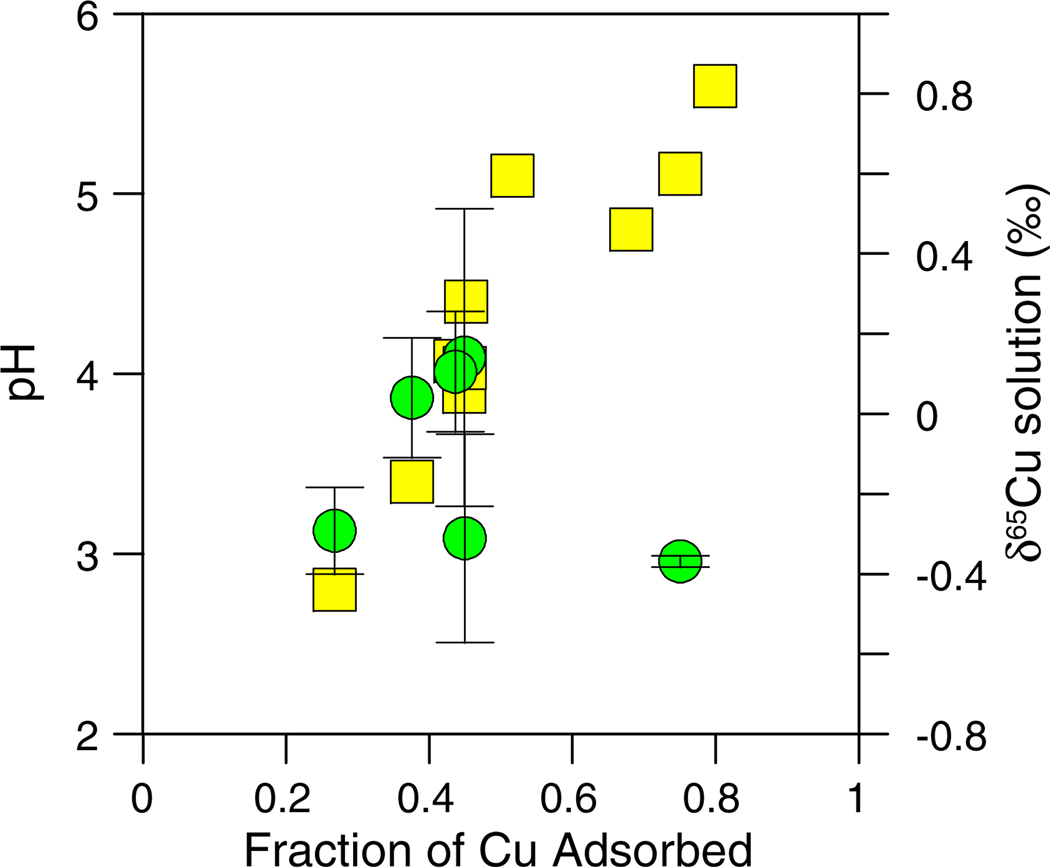
Fig. 3.
Cu concentration (yellow squares) and δ65Cu (green circles) data plotted as a function of the fraction of Cu adsorbed for the experiment with 10 mg/L Cu and 5 g/L of dead (heat-killed) E. coli. (For interpretation of the references to color in this figure legend, the reader is referred to the web version of this article.)

