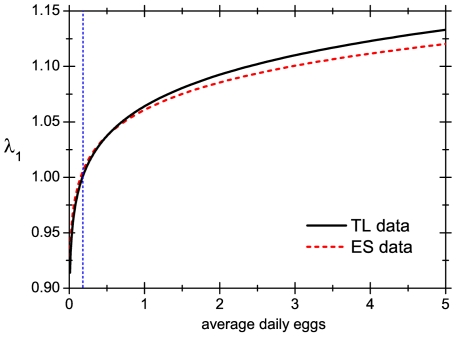
Figure 2. Intrinsic growth rate.
Behaviour of the intrinsic growth rate for a lice population as a function of the average of daily eggs laid by a single female. The rest of the parameters that define the population are taken from [8] (Takano-Lee curve) and [23] (Evans/Smith curve). The vertical line shows the position of the critical value of daily eggs.

