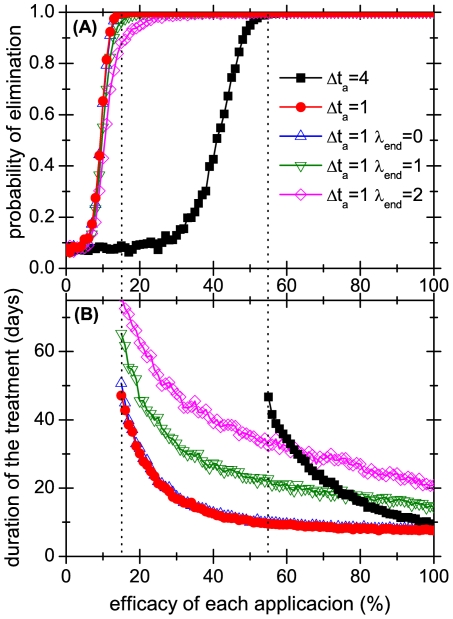
Figure 4. Results of applying different treatments to cure a head lice infestation.
The upper panel shows the probability that the infestation is cured (i.e. that all head lice and eggs are eliminated) and the lower panel shows the duration of the treatment, when it is successful. Both variables are plotted as functions of the fraction of lice that are eliminated by each application of the treatment for a fixed ovicidity of  . The limit time in our simulations to allow for the extinction of the colony was
  days of simulation time. Dotted vertical lines indicate the critical efficacy of the treatments.

