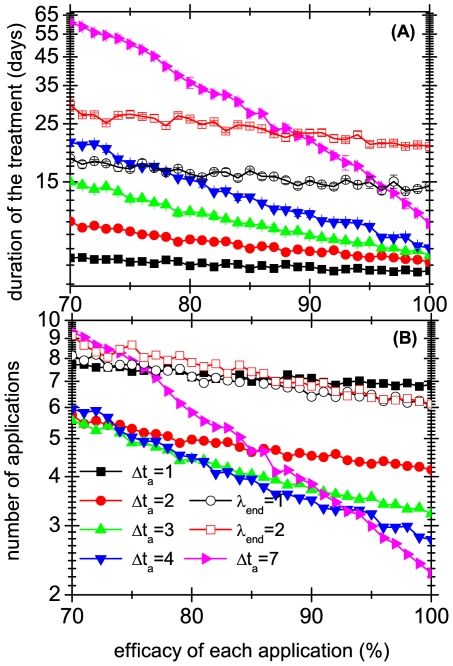
Figure 5. Average durations and number of necessary applications of different treatments.
Average durations are shown in panel A and the number of necessary applications to cure the infestation are shown in panel B. Results correspond to several treatments, when they are successful, and are shown as a function of the fraction of lice eliminated by each application. Full symbols indicate systematic treatments, and  gives the number of days between applications. Empty symbols correspond to a daily application (
 ) of non systematic treatments which are stopped when the mobile lice remaining in the population are less of equal than
  .
.

