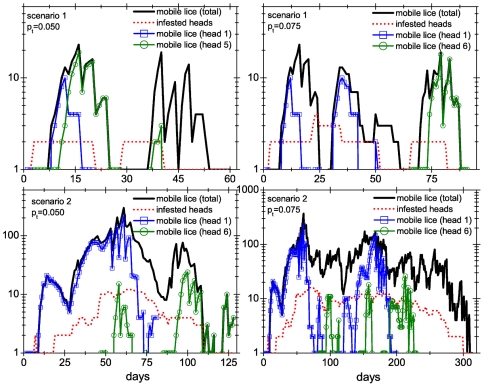
Figure 8. Time evolution of 4 different collective infestations.
Behavior of the colonies in scenario 1 (upper panels) and scenario 2 (lower panels) and for two values of the probability of transfer:  (left panels) and
  (right panels). In all panels the total number of mobile lice as well as the number of infested heads is shown. For the sake of clarity, we only show the evolution of the infestation of two heads. Head 1 is the one where the first female louse appears, whereas the other is randomly chosen. Besides, for scenario 2 head 1 is also the superspreader head.

