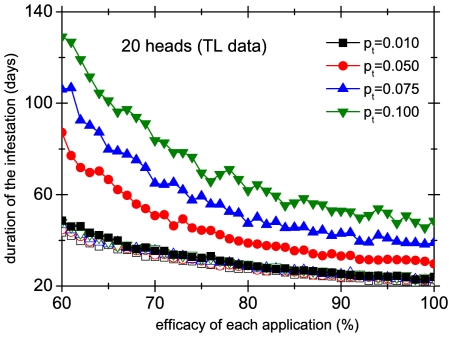
Figure 11. Performance of different treatments in a group of 20 heads.
Duration of the infestation as a function of the efficacy of each application for a systematic treatment applied every 4 days, implemented in a synchronized (open symbols) and unsynchronized way (full symbols). Different curves correspond to different values of the transmission probability  . For the unsynchronized case we have used scenario 1.

