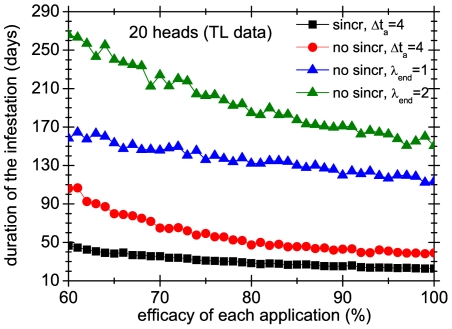
Figure 13. Effect of treatment systematicity on a group of 20 heads.
Average duration over 1000 realizations of 4 different treatments in group of 3 heads, as a function of the efficacy of each application. Squares and circles correspond to systematic treatments, whereas triangles represent non-systematic ones.

