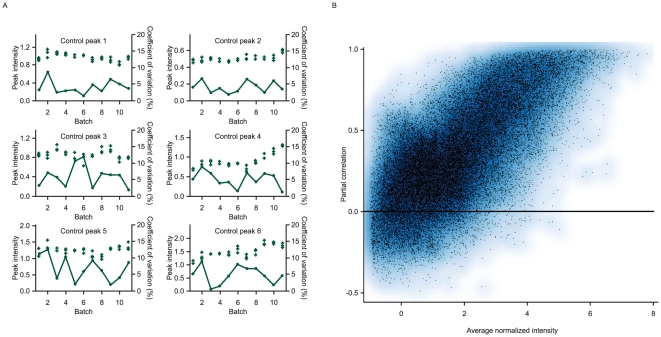
Figure 1. Quality control: reproducibility of control samples and sample duplicates.
(A) Reproducibility of 6 control peaks for the 3 standard quality control samples, plotted as ‘+’, in each analysis batch (peak intensity, left axis). The coefficients of variation (%, right axis) between the 3 control samples in each batch are plotted as points joined by a line. (B) Reproducibility of peptide intensities for 39 samples with duplicate analyses in different analysis batches. Partial correlation, after removing between batch differences, plotted against the average normalized intensity for each peptide. Higher intensity peptides show high reproducibility in their intensities between repeated batches.

