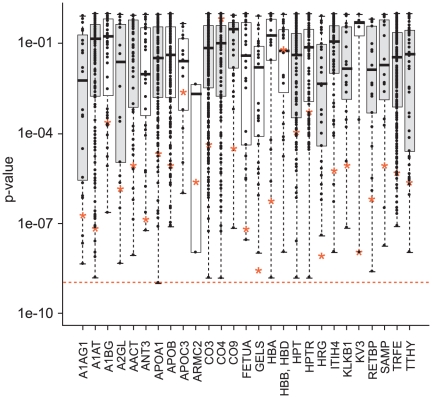
Figure 7. Significance levels from the proteins, constituent peptides, and acute phase pathway intensities.
p-values for the proteins are shown by red stars, p-values for individual peptides are shown by points, and the distribution of these for each protein is shown by a boxplot. In each boxplot, the upper and lower sides of the box represent the higher and lower quartile values (Q3 and Q1), respectively. The black bar in each box represents the median value. The p-value for the acute phase pathway is represented by the dashed line; boxplots for proteins in the acute phase response pathway are shaded. A1AG1 = alpha-1-acid glycoprotein 1; A1AT = alpha-1-antitrypsin; A1BG = alpha-1B-glycoprotein; A2GL = leucine-rich alpha-2-glycoprotein; AACT = alpha-1-antichymotrypsin; ANT3 = antithrombin-III; APOA1 = apolipoprotein A-I; APOB = apolipoprotein B-100; APOC3 = apolipoprotein C-III; ARMC2 = armadillo repeat-containing protein 2; CO3 = complement C3; CO4 = complement C4-A; complement C4-B; CO9 = complement component C9; FETUA = alpha-2-HS-glycoprotein; GELS = gelsolin; HBA = hemoglobin alpha; HBB, HBD = hemoglobin beta/delta; HPT = haptoglobin; HPTR = haptoglobin-related protein; HRG = histidine-rich glycoprotein; ITIH4 = inter-alpha-trypsin inhibitor heavy chain H4; KLKB1 = plasma kallikrein; KV3 = Ig kappa chain V-III region Ti; RETBP = retinol binding protein 4; SAMP = serum amyloid P-component; TRFE = serotransferrin; TTHY = transthyretin.

