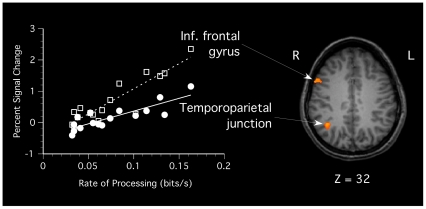
Figure 4. Scatter plot showing the correlation between brain activation and processing speed in the search task (as measured in bits/s) for right-lateralized regions in (a) inferior frontal gyrus (BA 9; center of mass at Talaraich coordinate: 53, 12, 32) and temporoparietal junction (BA 39; 38, −55, 31).
All activations surpassed a whole-brain voxel-level threshold of p<0.001 (uncorrected) with a cluster-corrected threshold of p<0.05, with R 2 = 0.76 in the inferior frontal gyrus and R 2 = 0.75 in the temporoparietal junction.

