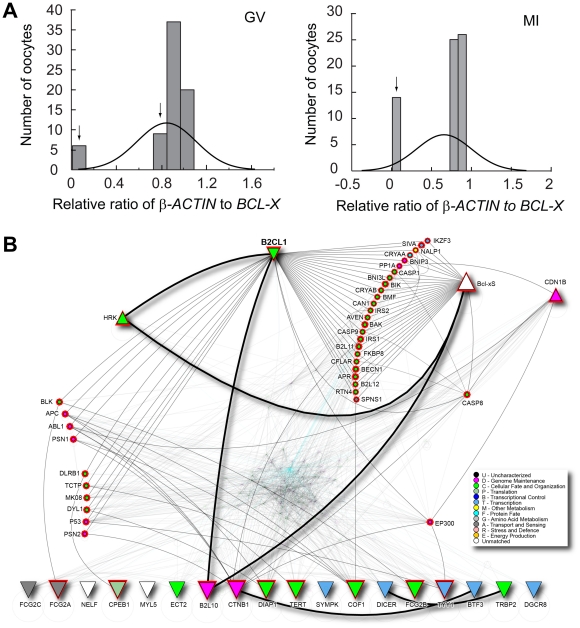
Figure 5. Expression of BCL-X in human oocytes.
(A) Distribution of human oocytes obtained form 43 patients based on their BCL-X expression in either germinal vesicle stage (GV - left) or meiosis I stage (MI - right). Arrows point to groups of oocytes with insufficient endowment of BCL-X transcript. (B) Visualization of protein interaction network that connects BCL-X (BC2L1) with other targets known to be deregulated in arrested human embryos. Node shape, represented by triangles, indicates trends of expression. Shape of triangles pointing up corresponds to genes up-regulated and triangles pointing down correspond to genes down-regulated in arrested human embryos; circles represent direct interacting partners that link BCL-X (BCL2L1) to up- and down-regulated targets. Red highlight on nodes represents the set of cross-linked proteins. Node color is based on gene ontology as per legend. To reduce network complexity, all other nodes and edges are made partially transparent.

