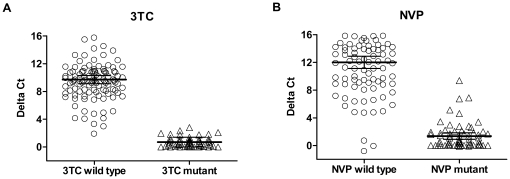
Figure 2. RT inhibition in 162 samples after virus concentration with CD44-coated beads.
Genotypes had been classified into wild type and mutant. Scatter plots show delta Ct values (threshold cycle difference between inhibited and uninhibited reaction) measured with 50 µM 3TC (A) and NVP (B). Horizontal bars indicate the respective mean values and the 95% confidence intervals. The established cut-offs for both drugs classified the isolates as summarized in Table 2. Data correlate well to those obtained by ultracentrifugation (Figure 1) with slightly more discrepancies between geno- and phenotype for NVP.

