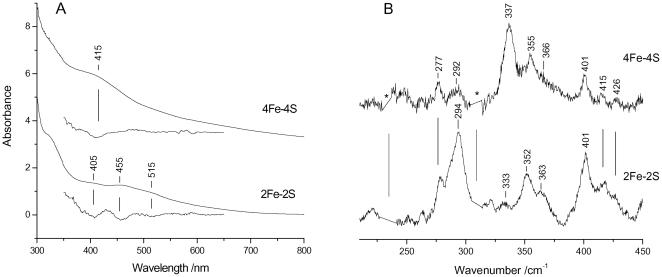
Figure 1. RR and electronic absorption spectra of Fe-S clusters assembled on E. coli IscU.
(A) Electronic absorption spectra in both normal and second derivative presentations of [2Fe-2S]2+ and [4Fe-4S]2+ clusters, and (B) RR spectra of almost pure [2Fe-2S]2+ and [4Fe-4S]2+ clusters. RR experimental conditions: excitation wavelength 413.1 nm, spectral resolution 1 cm−1, laser power at the sample 55 mW; ([2Fe-2S]2+) average of eleven spectra with 15 min integration time; ([4Fe-4S]2+) average of nine spectra with 10 min integration time. The asterisks indicate laser plasma lines that have been removed.

