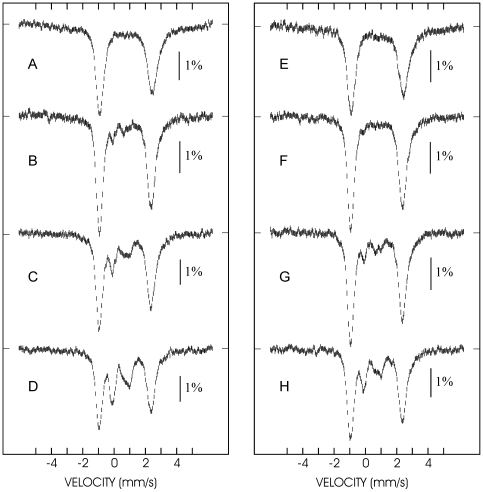
Figure 2. Mössbauer spectra of the FeS cluster assembly reaction.
The spectra were recorded in the absence (left panel, spectra A (top) – D (bottom)) and in the presence (right panel, spectra E (top) – H (bottom)) of CyaY. The spectra were recorded at 4.2 K and with a magnetic field of 60 mT applied parallel to the γ ray.

