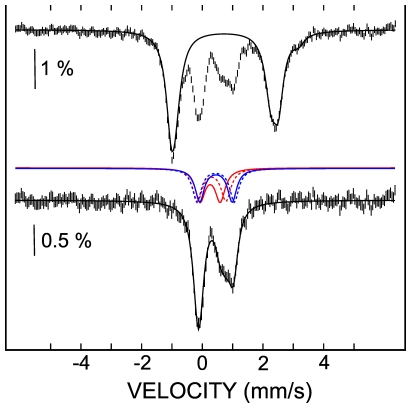
Figure 3. Analysis of the Mössbauer spectrum.
The spectrum D of figure 3 is deconvoluted. The spectrum was recorded in the absence of CyaY at 4.2 K and with a magnetic field of 60 mT applied parallel to the γ ray. The top spectrum illustrates the deconvolution of the contribution of the ferrous ions. The bottom spectrum was obtained by subtracting the simulated contribution of the ferrous ions (black solid line in top spectrum) from the experimental spectrum. The remaining contribution results from a mixture of a [2Fe-2S]2+ cluster (red lines) and a [4Fe-4S]2+ cluster (blue lines).

