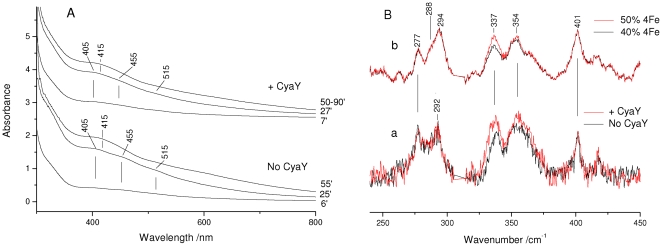
Figure 5. Kinetics of cluster formation.
(A) Electronic absorption spectra obtained during the time course of Fe-S synthesis on E. coli IscU at the times indicated. (B) (a) Superposition of the RR spectra obtained during the time course of Fe-S synthesis in the time interval 30–60 min (no CyaY, black) and 30–90 min (+CyaY, red). (b) Superposition of the RR spectra for admixtures of the pure species shown in Figure 1: 50% [4Fe-4S]2+ /50% [2Fe-2S]2+ (red) and 40% [4Fe-4S]2+ /60% [2Fe-2S]2+ (black). RR experimental conditions: excitation wavelength 413.1 nm, spectral resolution 1 cm−1, laser power at the sample 50 mW; (no CyaY) average of 5 spectra with 10 min integration time; (+CyaY) average of 10 spectra with 10 min integration time. The spectra are normalised on the 294 cm−1 band of the [2Fe-2S]2+ cluster. The asterisk indicates a laser plasma line which has been removed.

