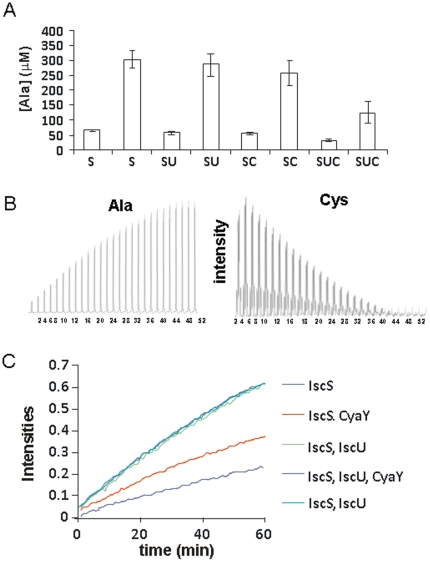
Figure 6. Influence of CyaY on the enzymatic activity of IscS.
A) Dosage of the alanine formed at different times. Each measurement is reported twice and corresponds to 5 and 20 min after starting the reaction. S, SU and SUC indicate different mixtures of IscS, IscU and CyaY. B) Kinetics of cysteine consumption with concomitant alanine formation. Peak intensities of the b-protons of alanine (left) and cysteine are reported as a function of time. C) Same as in B) but plotting the results of experiments recorded in the presence of different mixtures of IscS, IscU and CyaY. The two curves in the presence of IscU (which superpose perfectly) correspond to two independent kinetics performed with 12 hours interval to check for reproducibility.

