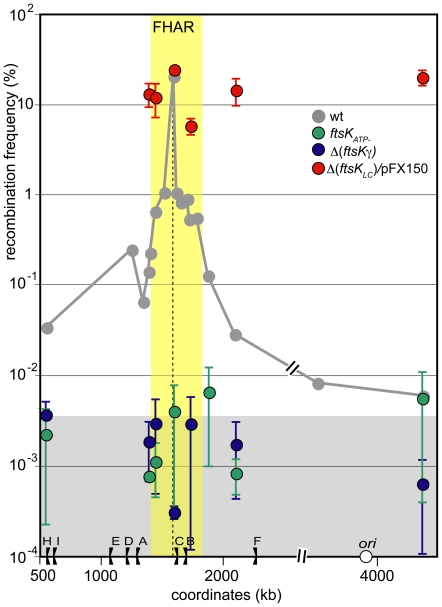
Figure 3. Preferential interaction with the FtsK high activity region requires all domains of FtsK.
Same legend as Figure 2. The grey curve corresponds to ftsKwt strains and is redrawn from figure 2. Recombination frequencies were measured at chosen loci in different ftsK mutant: Green dots: ftsK ATP-; blue dots: Δ(ftsKγ); red dots Δ(ftsK LC) strains producing FtsKC from plasmid pFX150 (Materials and methods). The yellow zone indicates extend of the FtsK high activity region and the grey zone the FtsK-independent recombination background (see Figure 2).

