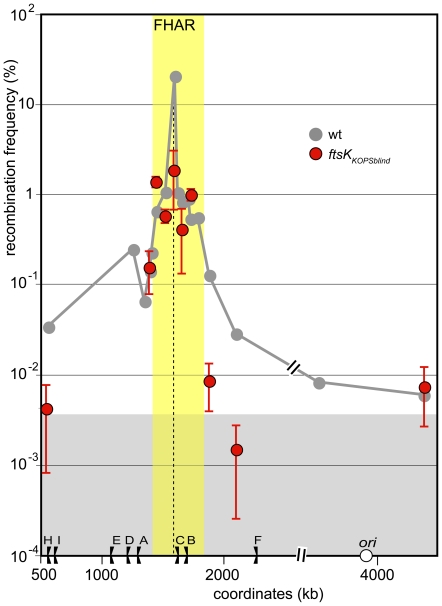
Figure 4. KOPS recognition is not required for preferential interaction of FtsK with the FtsK high activity region.
Same legend as Figure 2 and 3. Grey curve: ftsKwt, redrawn from figure 2; red dots ftsK KOPSblind. The yellow zone indicates the FtsK high activity region and the grey zone the FtsK-independent recombination background (see Figure 2).

