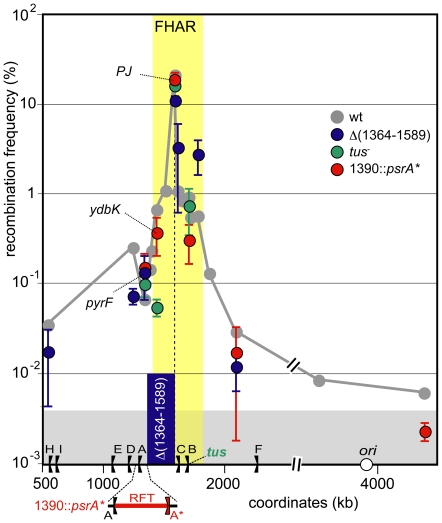
Figure 5. Specificity of the FtsK high activity region.
Same legend as Figure 2 and 3. Green dots: strains were mutated for the tus gene. The position of the tus gene is indicated on the X-axis. Red dots: An additional replication terminator, psrA* (A*), was inserted at position 1390. The resulting restricted replication fork trap (RFT) is shown in red bellow the X-axis. Blue dots: strains were deleted of the 1364–1589 fragment (Materials and methods). The deleted fragment is shown as the blue bar. Positions of a subset of loci are shown on the graph. PJ indicates the junction of KOPS polarity (i.e., the endpoints of the deletion in the Δ(1364–1589) strain and the natural position of dif in the other strains. The yellow zone indicates extend of the FtsK high activity region and the grey zone the FtsK-independent recombination background (see Figure 2).

