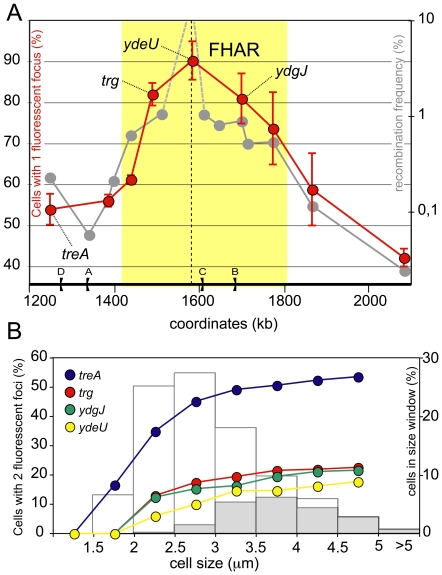
Figure 6. Delayed segregation of the FtsK high activity region.
(A) Strains carrying a parS insertion at chosen loci and producing the GFP-Δ30ParB protein were observed under the microscope and the ratio of cells with 1 fluorescent focus on total cells was calculated (reft dots; left Y-axis; Materials and methods). The means of at least 3 independent measures with standard deviation are plotted (n>250 cells for each measure). The grey curve and yellow zone are redrawn from Figure 2 for comparison, omitting the dif natural position (right Y-axis). The dotted line indicates the natural dif position. (B) Data from (A) were sampled in cell size windows (0.5 µm each, X-axis) and the fraction of cells with 2 segregated fluorescent foci was plotted (left Y-Axis) for the four representative loci indicated. The distributions of cells in the same cell size windows is shown as histograms (right Y-axis). Open bars: total cells; Grey bars: cells harbouring a constricting division septum.

