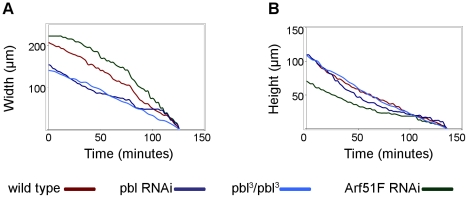
Figure 4. Quantification of abnormal dorsal closure dynamics.
(A and B) Graphs showing closure kinetics of the dorsal hole in a buffer-injected control embryo, in a homozygous pbl3 mutant embryo and embryos silenced for pbl and Arf51F. For each category, data of individual representative embryos are shown. (A) “Width” represents the maximal distance between zippering ends. (B) “Height” represents the maximal distance between the converging epithelial layers. Velocity of the epithelial sheet translocation (v), the rate constant of zippering (kz) and the fractional contribution of zippering (fz) to the velocity of the closure were calculated as described [22].

