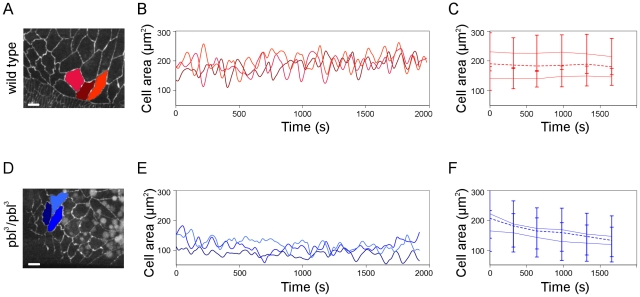
Figure 7. Pulsative behavior of the amnioserosa cells in pbl mutants.
(A and D) Frames from movies of arm:GFP-expressing embryos. Scale bars are 10 µm. (B and E) Graphs showing amnioserosa cell surface fluctuations of the cells highlighted in A and D. (C and F) Mean of the apical surface maxima and minima for amnioserosa cells. Dashed lines represent average surface area of the cells (n = 18 cells in 3 embryos for wild type and n = 17 cells in 3 embryos for pbl3/pbl3 mutant). (A,B,C) Wild-type control embryo. (D,E,F) pbl3/pbl3 mutant embryo.

