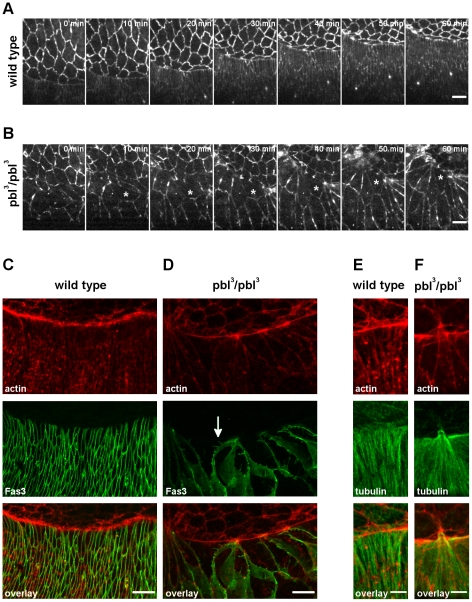
Figure 9. Dorsoventral polarity of the DME cells in pbl mutants.
(A and B) Frames from movies of arm:GFP-expressing embryos. Dorsal view is shown, scale bars are 10 µm. (A) Wild-type embryo. (B) pbl3/pbl3 mutant embryo. Asterisk labels the same cell, progressively elongating along the D/V axis. (C–F) Immunofluorescence staining of DME cells in embryos at dorsal closure stage with anti-Fas3 (green in C and D) and anti-tubulin antibody (green in E and F). Phalloidin staining of actin in DME cells (red in C–F). White arrow indicates the intrusions of the basolateral membrane. Maximum intensity projections of optical sections encompassing the whole cell volume are shown. Scale bars represent 10 µm in C and D and 5 µm in E, F. (C and E) Wild-type embryos. (D and F) pbl3/pbl3 mutant embryos.

