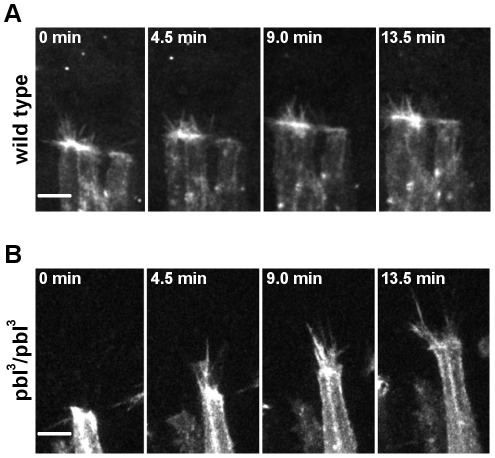
Figure 10. Protrusion dynamics in the DME cells of pbl mutants.
(A and B) Frames of movie sequences showing DME cell protrusion dynamics in embryos expressing mCherry:Moe in engrailed-expressing cell stripes. Scale bars are 5 µm. (A) en-Gal4, UAS-mCherry:Moe control embryo. (B) Homozygous en-Gal4, UAS-mCherry:Moe; pbl3 embryo.

