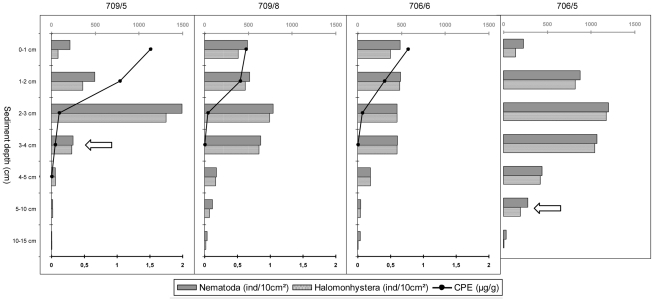
Figure 2. Vertical profiles of nematode densities, Halomonhystera densities and CPE concentration per sediment layer.
Scale bars have been made uniform for comparison. White arrows indicate the position of the sulphidic layer as observed upon sampling [28].

