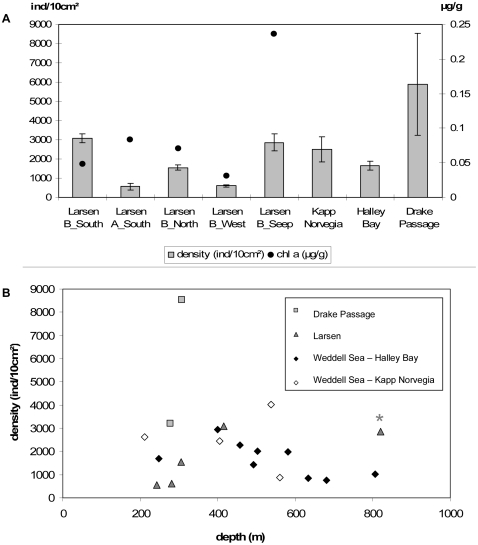
Figure 4. A. Nematode densities in comparison with other Larsen and Weddell Sea stations.
Average nematode densities (in ind/10 cm2, bars) and chlorophyll a concentrations (µg/g, dots) for the different Larsen stations and reference areas. Bars represent standard errors. Note that for the reference stations, pigment data are not shown because they were expressed in µg/cm3 and hence could not be compared. B. Nematode densities (ind/10 cm2) for the different stations relative to their depth (0–1000 m). The position of the Larsen B_Seep station is marked with an asterisk*.

