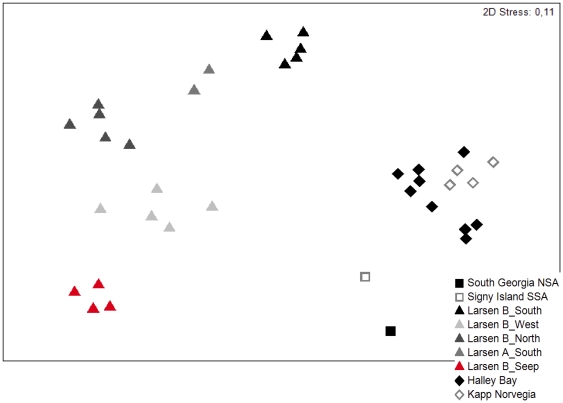
Figure 5. nMDS plot.
The plot is based on Bray-Curtis similarities of the Larsen replicates ([3]; this study) and the reference data of the Weddell Sea [26] and Drake Passage [24]. Data have been standardised and square-root transformed prior to analysis. The stress value in the upper right corner indicates the goodness-of-fit of the MDS plot.

