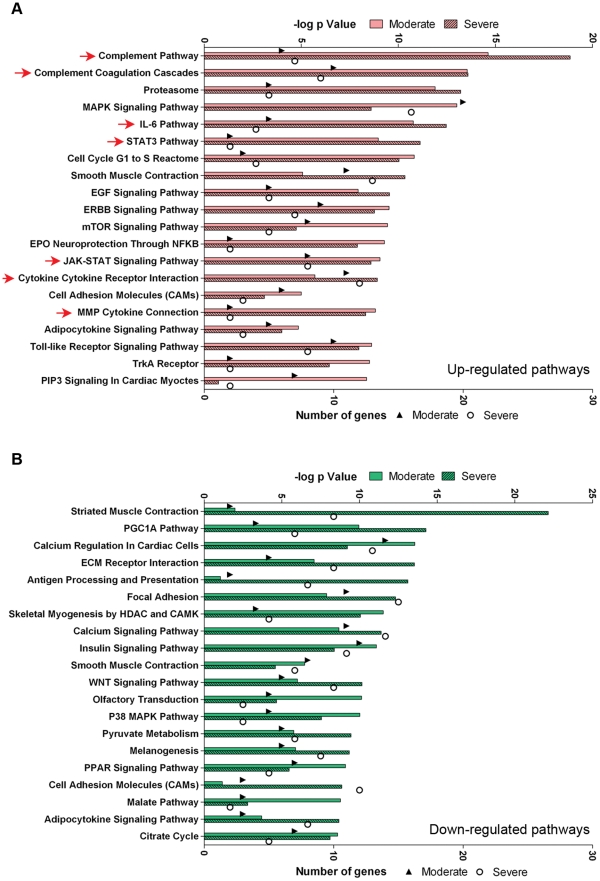
Figure 4. C26 cachexia pathway analysis.
A. The top 20 Broad MSigDB canonical pathways significantly up-regulated in moderate and severe cachexia versus controls. Pink bars (upper axis) represent the significance of the overlap. The triangles (moderate cachexia) and circles (severe cachexia) (lower axis) denote the number of genes differentially expressed in that pathway. Red arrows indicate pathways related to IL-6/STAT3/inflammation. B, The top 20 Broad MSigDB canonical pathways significantly down-regulated in moderate and severe cachexia versus controls. Green bars (upper axes) represent the significance of the overlap. The triangles (moderate cachexia) and circles (severe cachexia) (lower axis) as above.

