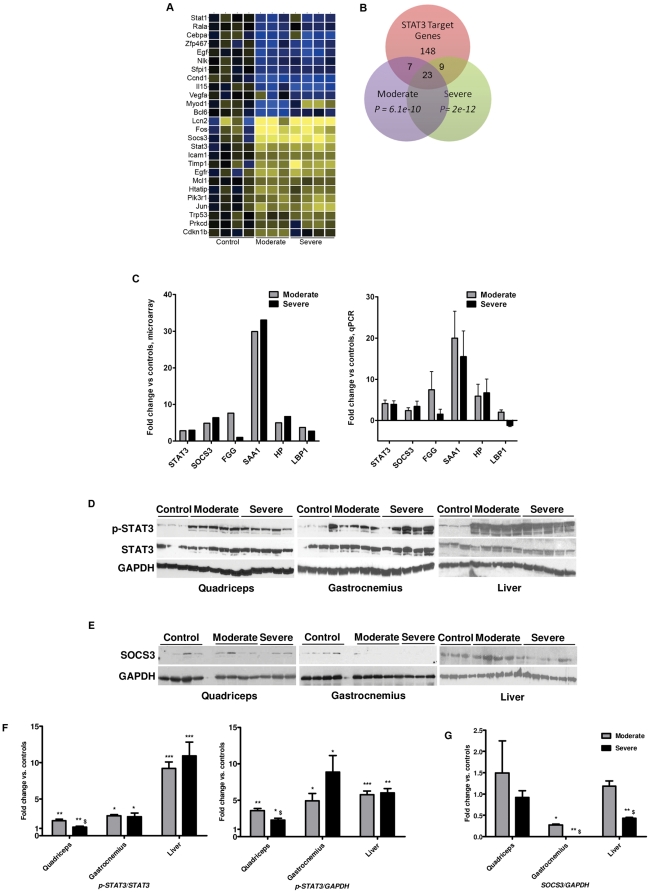
Figure 5. STAT3 and its target genes are activated in muscle in C26 cachexia.
A: Heat map of gene expression changes of Stat3 and co-cited gene products, as identified by Genomatix Bibliosphere. Blue indicates down regulated genes, yellow up regulated, and black no change. Only genes with P<0.05 by one-way ANOVA are shown. B: A subset of STAT3 target genes identified through the literature are differentially regulated in moderate and severe cachexia versus controls. C: STAT3 and its target genes SOCS3 and CEBPD are increased at the mRNA level by microarray and qPCR. D: Protein levels for p-STAT3 and STAT3 in protein extracts from quadriceps, gastrocnemius and liver evaluated by Western blotting analysis. E: SOCS3 protein levels. F: quantitative analysis of p-STAT3/STAT3 and p-STAT3/GAPDH ratio (expressed as fold-change vs. controls). G: quantitative analysis of SOCS3 protein levels (expressed as fold-change vs. controls). GAPDH was used as an internal reference to confirm equal loading. n = 3–5 per group; *P<0.05, **P<0.01, ***P<0.001 vs. Controls, $P<0.05 vs. moderate.

