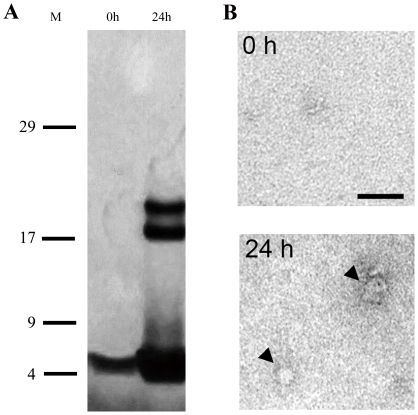
Figure 3. Formation of oligomeric Aβ1–42 assemblies.
(A) Profiles of Aβ1–42 oligomers before (0 h) and after 24-h incubation (24 h) on SDS-PAGE followed by silver staining. M: Molecular weight markers. 0 h: Aβ1–42 preparation 0 h at 4°C. 24 h: Initial ADDL preparation 24 h later at 4°C. (B) Electrophoretic pattern of Aβ1–42 oligomeric preparations separated with centrifugal filters before electrophoresis. Representative photographs showing Aβ1–42 preparations before (0 h) and after incubation (24 h). Arrowheads in B indicate Aβ1–42 oligomers. Scale bar: 50 nm.

