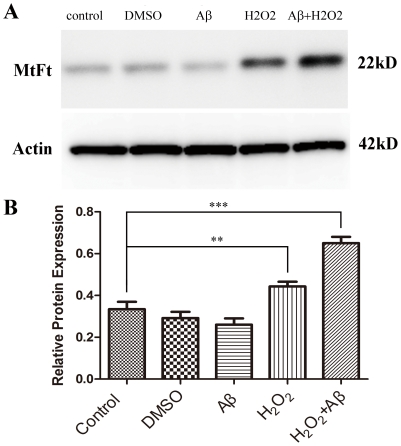
Figure 6. Western-blot analysis of MtF expression in each in vitro experiment group.
(A) An immunoreactive band of approximately 22 kD probed with an anti-MtF antibody is present in all lanes. (B) When the expression level of MtF is normalized to β-actin, MtF expression after treatment with H2O2 or with a combination of Aβ and H2O2 was significantly greater than that in control cases (**p<0.01. *** p<0.001). However, treatment with Aβ or DMSO alone shows no significant effect on MtF expression.

