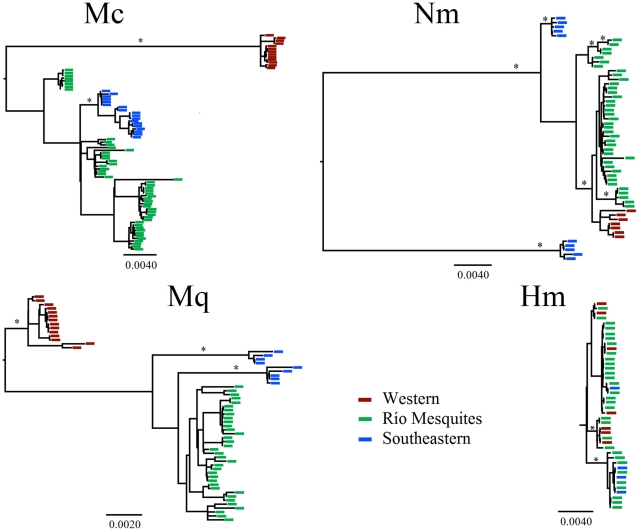
Figure 4. Gene genealogies for Mexipyrgus churinceanus (Mc) and Herichthys minckleyi (Hm) cytochrome b haplotypes, and for Mexithauma quadripaludium (Mq) and Nymphophilus minckleyi (Nm) COI haplotypes.
Asterisks represent Bayesian a posteriori support probabilities that exceeded 0.95. Time to most recent common ancestor (myr) for each species is presented at most basal node. The scale bar at the bottom left is proportional to branch length, measured as the number of DNA substitutions per site.

