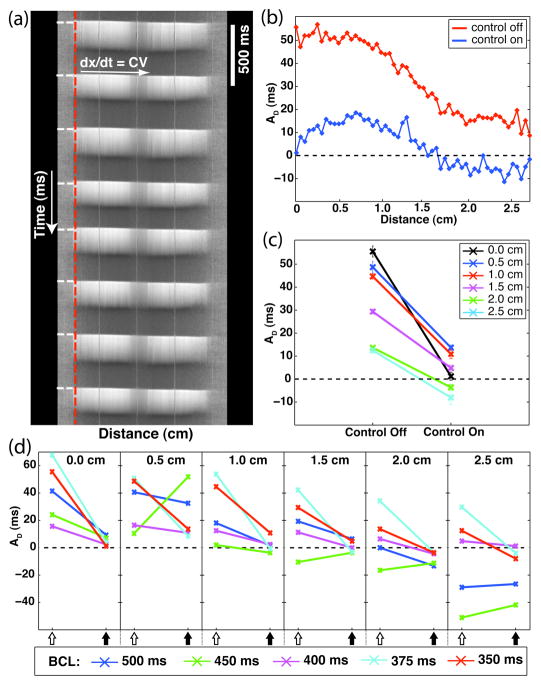
Fig. 2.
Examples of spatial alternans dynamics. (a) Example distance-time plot of relative fluorescence data. Shown is the propagation of eight action potentials along the length of the tissue (BCL = 420 ms; CV = 92 cm/s). Color-coding: white – depolarized fluorescence; gray – resting fluorescence. The vertical-dashed red line and the horizontal-dashed white lines on the left-hand side of the plot correspond to the spatial location of the stimulating electrode and the timings of the applied stimulus current, respectively. The three equally spaced wavy vertical lines are from the calibration coverslip, which was placed over the sample preparation (1 cm spacing). This signal was detrended and smoothed according to the methods described in Section II.C. (b)–(d): Phase-specific alternans magnitudes, AD, measured during control-off and control-on conditions (preparation #1). (b) Measurements from each channel within the field-of-view (BCL = 350 ms). Control-off – red; Control-on – blue. (c) Measurements from equally spaced locations from the control channel (distances = 0.0, 0.5, 1.0, 1.5, 2.0, and 2.5 cm; BCL = 350 ms). (d) Spatial measurements derived from all experiment trials performed on preparation #1 (BCL = 500, 450, 400, 375, and 350 ms). Open-arrows: control-off; closed-arrows: control-on.

