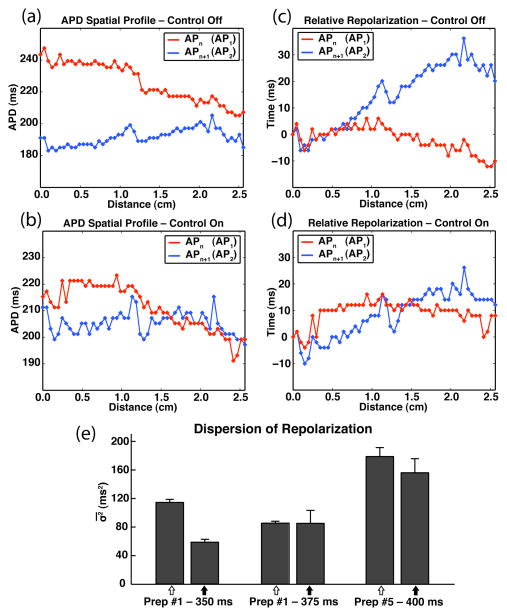
Fig. 4.
Control-induced transition from concordance (control-off) to discordance (control-on). (a)–(b) Representative APD spatial profiles for APn and APn+1 (first two action potentials of six-AP sequence) during control-off (a) and control-on (b). (c)–(d) Representative relative repolarization times for APn and APn+1 during control-off (c; AP1-σ2: 22.4 ms2, AP2-σ2: 122.2 ms2) and control-on (d; AP1-σ2: 13.5 ms2, AP2-σ2: 59.9 ms2) conditions. (a–d: Preparation #1 – BCL = 350 ms.) (e) Control-off:control-on (open-arrows and closed-arrows, respectively) repolarization dispersion values ( ) derived from cases of concordant:discordant behavior (preparation #1 – BCL = 350, 375 ms; preparation #5 – BCL = 400 ms). Shown is the greater of the two σ2-mean ( ) values calculated for each six-AP sequence: or APn+1-σ2 (n=3).

