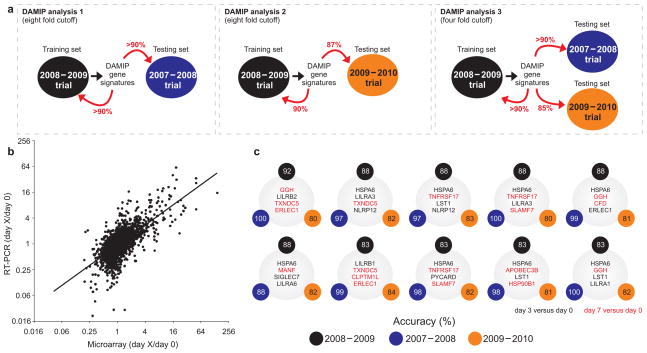
Figure 5.
Signatures that predict the antibody response induced by TIV. (a) Schematic representation of the experimental design used to identify the early gene signatures that predict antibody responses to TIV vaccination. The 2008–2009 Trial was used as a “training set to identify predictive signatures, using the Discriminant Analysis of Mixed Integer Programming (DAMIP) model. These signatures were then tested on the data from the 2007–2008 trial, which represents the “testing set.” The expression of a subset of genes contained within the DAMIP predictive signatures using the 2007–2008 and 2008–2009 trials was then quantified by RT-PCR in a third independent trial (2009–2010 trial). The DAMIP model was again used to confirm the predictive signatures. (b) The expression of a subset of genes contained within the predictive signatures generated by the DAMIP model was validated using RT-PCR. There was a statistically significant positive correlation (2,897 XY pairs, Pearson r = 0.68, P-value < 10−11) between the changes in relative gene expression determined by microarray and RT-PCR analysis. Each point represents a single gene at a given time point. (c) Some of the DAMIP gene signatures identified using 2008–2009 trial as training set and 2007–2008 and 2009–2010 trials as validation sets (i.e. DAMIP model 3). The accuracy represents the number of subjects correctly classified as “low responders” or “high responders” (see legend of Fig. 1a).

