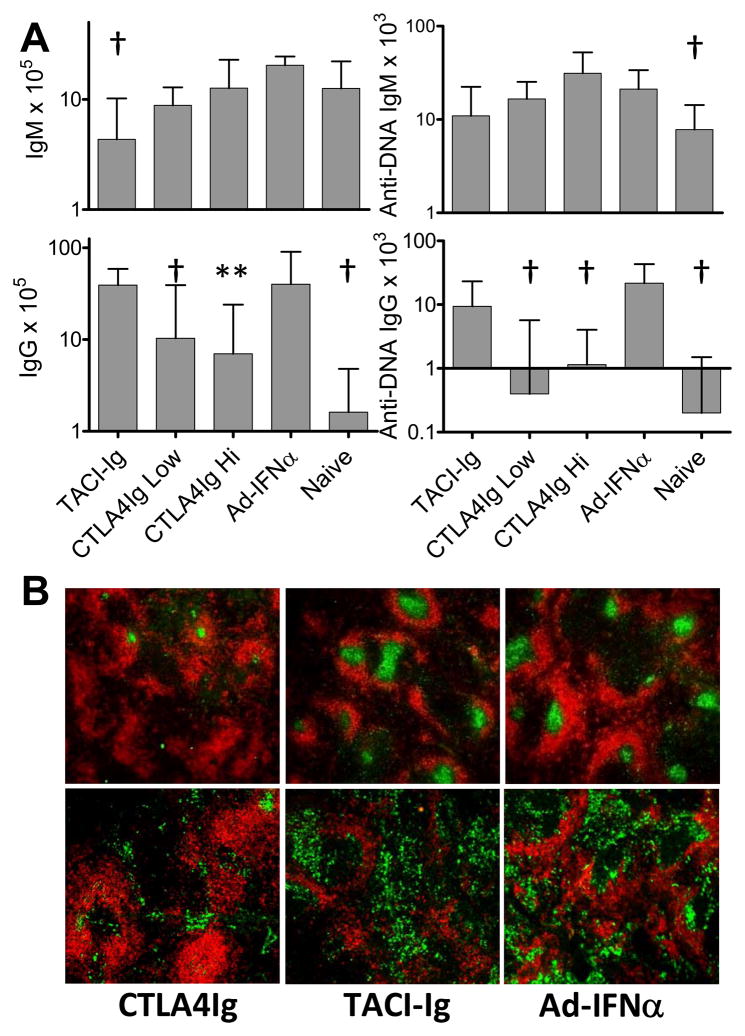
Figure 3.
Effects of treatments on germinal centers and plasma cells in the spleen. A: the numbers of IgG or IgM plasma cells per spleen from different groups of mice were determined by ELISpot assay. p values are compared with Ad-IFNα treated controls. Median + interquartile range shown *: p < 0.05, **: p < 0.02, †: p < 0.01. Data are representative of 2 experiments of 5–10 mice per group. B: immunofluorescence staining of spleens (5X magnification) with anti-IgD (red), peanut agglutinin (green; upper), and anti-IgG2a (green; lower). Data are representative of two experiments of 5–8 mice per group. Results are similar between the spleens from the mice treated with high dose or low dose CTLA4Ig. IgG3 producing B cells were present even in naïve mice and their numbers were variable both in treated mice and Ad-IFNα controls (not shown).

