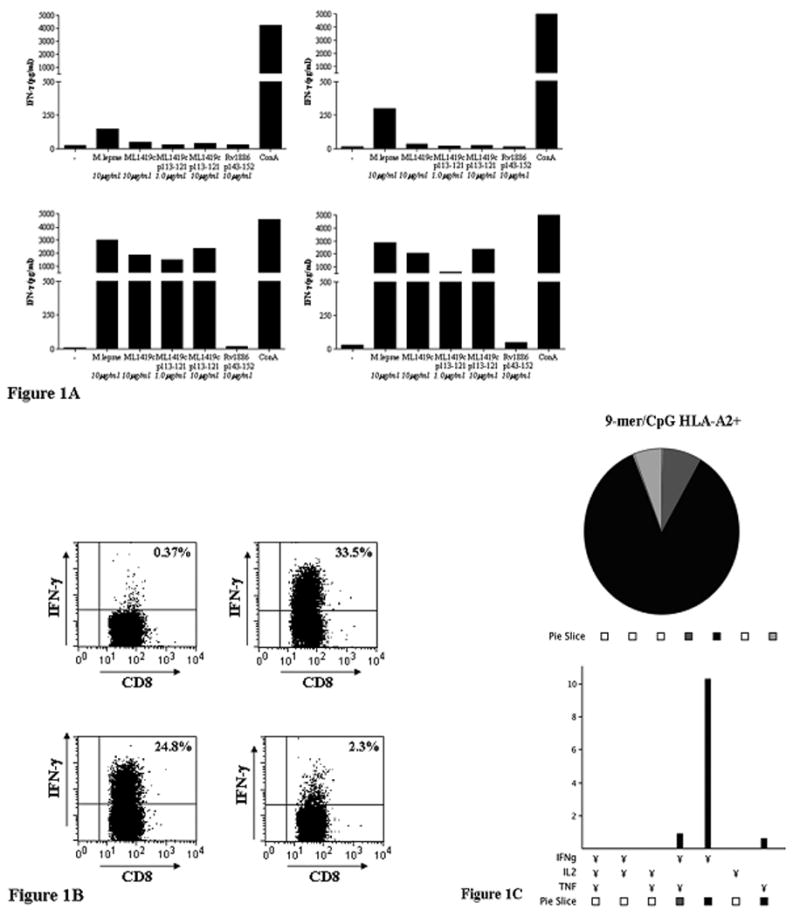
Figure 1.

Figure 1A: IFN-γ secretion. IFN-γ secretion was analyzed after 5 days in vitro stimulation of splenocytes with ML1419c p113-121, M. leprae sonicate or mitogen (conA). HLA-A2tg mice were unimmunized (upper left panel) or immunized with CpG alone (upper right panel), ML1419c p113-121 (9mer/ CpG; lower left panel) or ML1419c p100-129 (30mer/ CpG; lower right panel). The HLA-A*0201-restricted epitope Rv1886 (M. tuberculosis Ag85B) p143-152 (25) was used as a control for ML1419c-specificity. All test groups included five mice. All mice were separately analyzed. Results are shown for one animal and are representative for each test group.
Figure 1B: Intracellular IFN-γ production by CD8+ T-cells after ML1419c p113-121 immunization of HLA-A2tg mice. Mice were immunized twice with CpG alone (upper left), ML1419c p113-121 (9mer/ CpG; upper right), p108-122 (15mer/ CpG; lower left) or p100-129 (30mer/ CpG; lower right). Splenocytes were stimulated in vitro with the same peptides used for immunization. After 7 days, cells were incubated with medium or fresh peptide for 1h before addition of brefeldin A and analysis for intracellular IFN-γ production.
Figure 1C: Frequency of polyfunctional CD8+ T-cells. Percentage of CD8+ T-cells in HLA-A2tg mice, producing combinations of IFN-γ, TNF-α or IL-2 after in vitro stimulation with peptide (see 1B). Mice were immunized with ML1419c p113-121 (9mer/ CpG). The total number of CD8+ T-cells analysed in immunized mice was 56,000. Slices in pie chart represent the proportion of single, double or triple positive CD8+ T-cells for each antigen. Only CD8+ populations of > 5 × 10⁴ events were analyzed. In naïve mice the number of CD8+ T-cells producing cytokines was less than 5 × 10⁴c.
