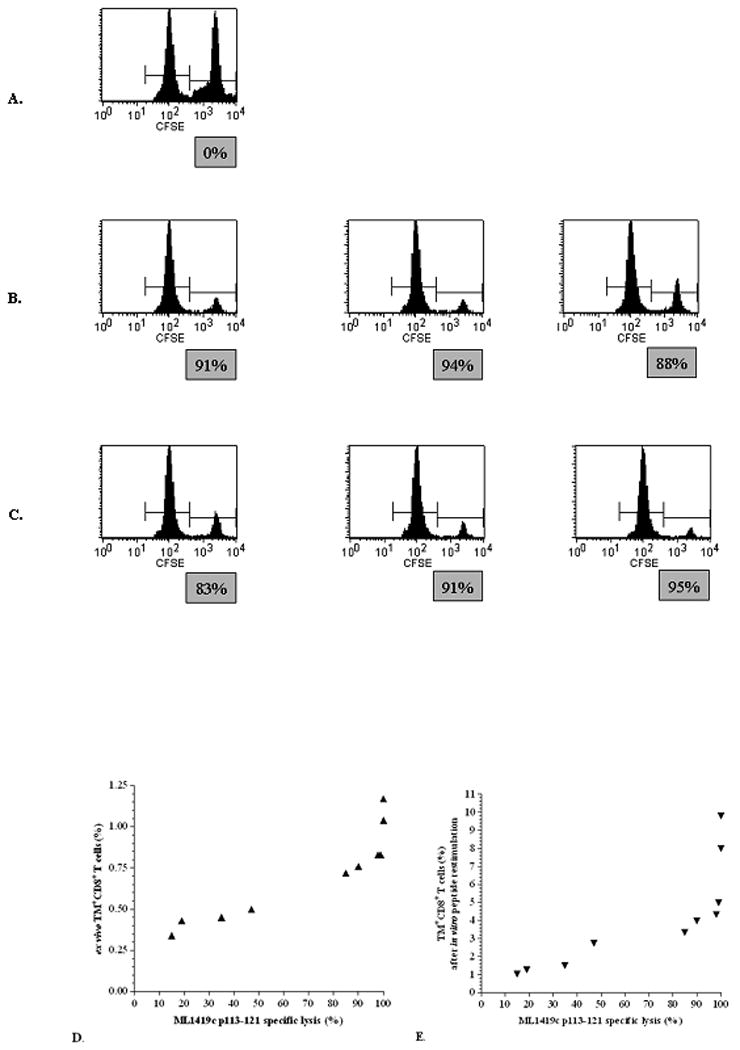
Figure 4. In vivo cytotoxicity.

CTL response in HLA-A2tg mice against ML1419c p113-121 as detected by lysis of ML1419c p113-121-pulsed, CFSEhigh labeled syngeneic target cells using flow cytometry. The y-axis indicates the number of cells and the x-axis the CFSE intensity. The figure shows one representative CpG-immunized animal (A; n = 5), three representative animals from the groups immunized with ML1419c p113-121/CpG (B; n = 5) and ML1419c p100-129/CpG (C; n =5). Results shown are representative for at least four separate experiments. Correlation of ML1419c p113-121-specific in vivo lysis in various experiments with the percentage of HLA-A2/p113 TM+ CD8+ T-cells directly ex vivo (D) or after in vitro peptide restimulation (E).
