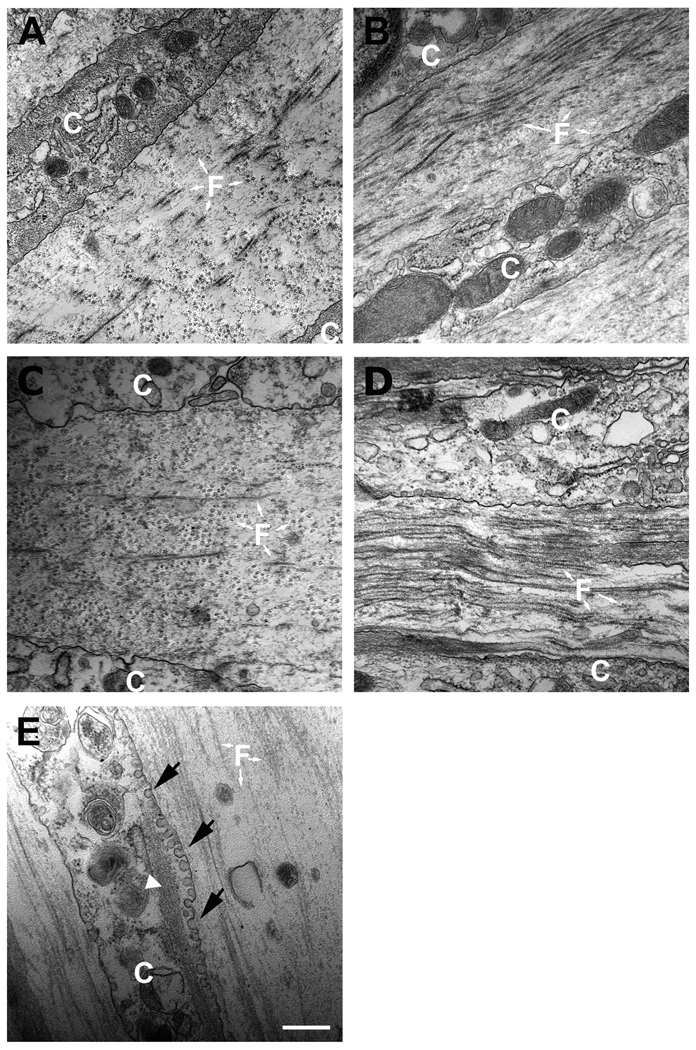
Figure 2.
TEM (31 000×) showing cell-matrix interaction and matrix condition. A) Control, B) TGF-β1 treated (T1), C) TGF-β2 treated (T2), and D) TGF-β3 treated (T3) constructs. The fibril orientation changes direction more than once in all conditions. T3 treated construct (D) shows higher density of collagen fibril and ECM alignment compared to controls, T1 and T2. T3 also appeared to show fewer cells with actin stress fibers (data not shown). E) Example of cell with vesicles (arrows) correlating with actin filaments (arrowhead). White “C” = cell and “F” = fibrils. Bars = 500nm.

