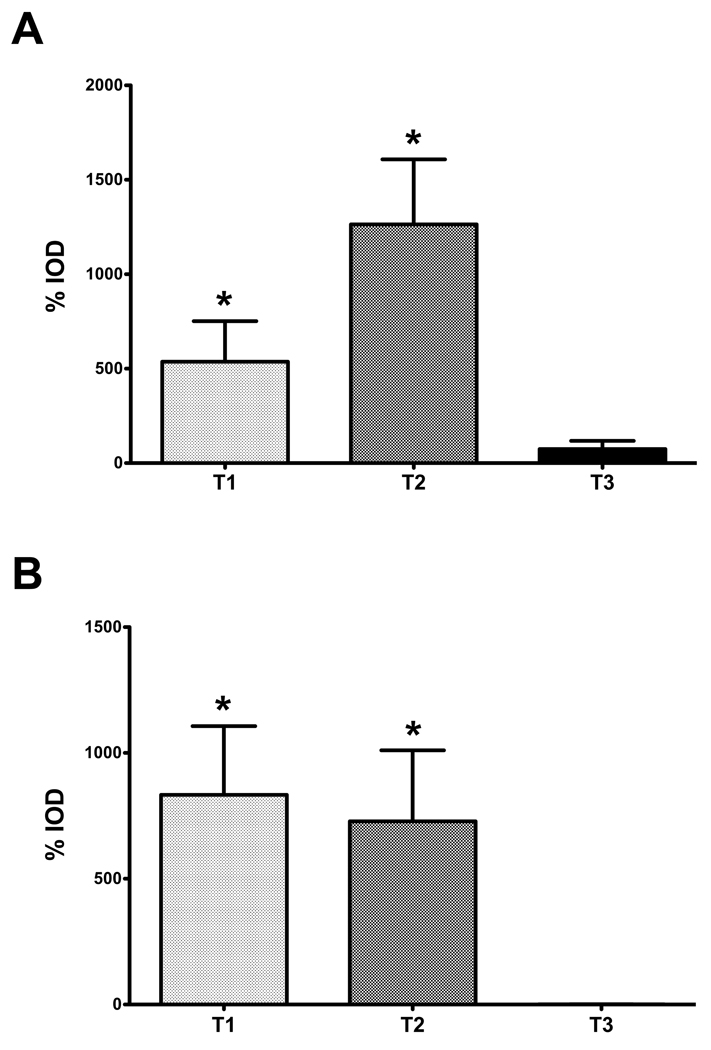
Figure 6.
Graph of the percent (%) integrated optical density (IOD) of SMA and type III collagen in the constructs. Four conditions were examined and analyzed after indirect immunofluorescence was performed with either SMA or type III collagen: (Control) VitC only, (T1) VitC + TGF-β1, (T2) VitC + TGF-β2, and (T3) VitC + TGF-β3. Data was plotted as the % increase of IOD for all conditions (T1, T2 and T3) compared to controls for both smooth muscle actin (A) and type III collagen (B). (A) %IOD for SMA expression significantly increased (*p<0.05) when cells were treated with T1 and T2. (B) Similar results were shown for type III collagen, with *p<0.05 for both T1 and T2. T3, however, had a %IOD of almost zero for both SMA (A) and type III collagen (B).

