
Figure 1. NANOG genomic loci and NANOG mRNA expression in PCa cells.
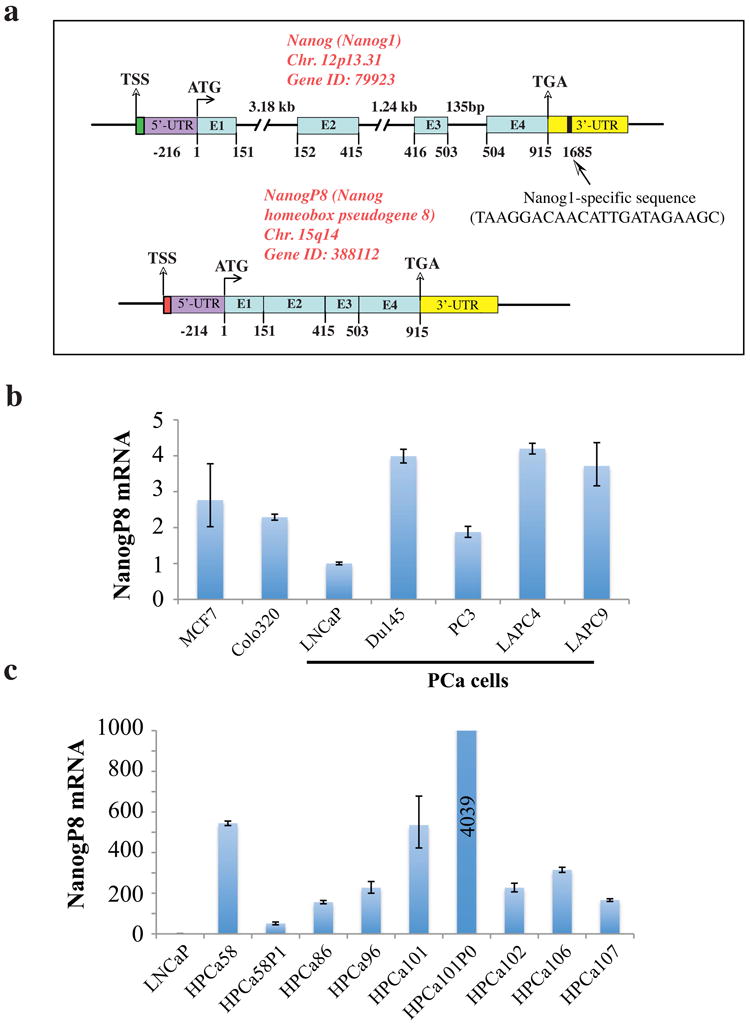
a) Schematic of NANOG1 and NANOGP8 gene structures. Chr, chromosome; E, exon; UTR, untranslated region. The 22-bp region unique to NANOG1 (vertical bar) was used to design primers/probes for NANOG1 and NANOGP8 specific PCR. b) Quantitative PCR (qPCR) detection of NANOGP8 mRNA expression in various cancer cells, normalized to GAPDH. The normalized NANOGP8 mRNA levels in LNCaP cells were set at 1 and NANOGP8 mRNA levels in breast (MCF7), colon (Colo320) and PCa cell lines (LNCaP, Du145 and PC3) and xenografts (LAPC-4 and LAPC-9) were presented relative to LNCaP. c) NANOGP8 mRNA levels in a cohort of primary patient tumors (HPCa) as determined by qPCR. HPCa56P1 and HPCa101P0 are two early-passage (P) xenografts established in our lab.