
Figure 2. Human blood eosinophil adherence as measured by EPO activity and immunofluorescence.
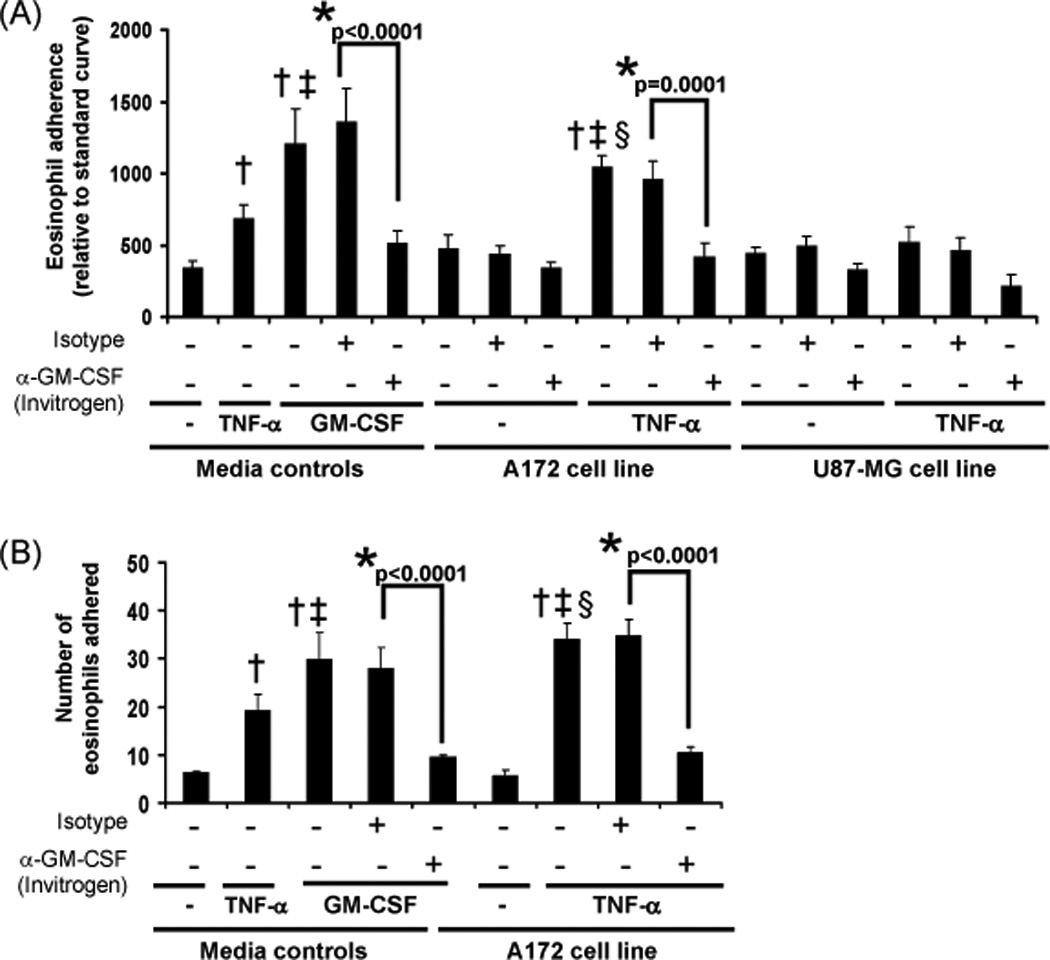
(A) Media controls (buffer, 100 pg/ml GM-CSF, 10 ng/ml TNF-α) or tumor cell lines stimulated (24 hr) with buffer control or 10 ng/ml TNF-α were treated with an isotype control or GM-CSF neutralizing antibody (1 hr) prior to adding eosinophils. An EPO assay was performed after 30 min incubation with eosinophils as described in the Materials and Methods. Data represent the average relative number of eosinophils adhered, +/− SEM, N=5, *p≤0.0001 vs respective isotype control, †p≤0.009 vs media control, ‡p≤0.005 vs TNF media control, §p<0.0001 vs A172 cell line control. (B) Media controls (buffer, 100 pg/ml GM-CSF, 10 ng/ml TNF-α) or tumor cell line cultures stimulated (24 hr) with buffer control or 10 ng/ml TNF-α were treated with an isotype control or GM-CSF neutralizing antibody (1 hr) prior to adding eosinophils. After a 10 min incubation with eosinophils, the cells were washed fixed and stained as described in the Materials and Methods. Data represent the average number of eosinophils adhered, +/− SEM, N=4, *p≤0.0001 vs respective isotype control, †p≤0.0006 vs media control, ‡p≤0.004 vs TNF media control, §p<0.0001vs A172 cell line control.