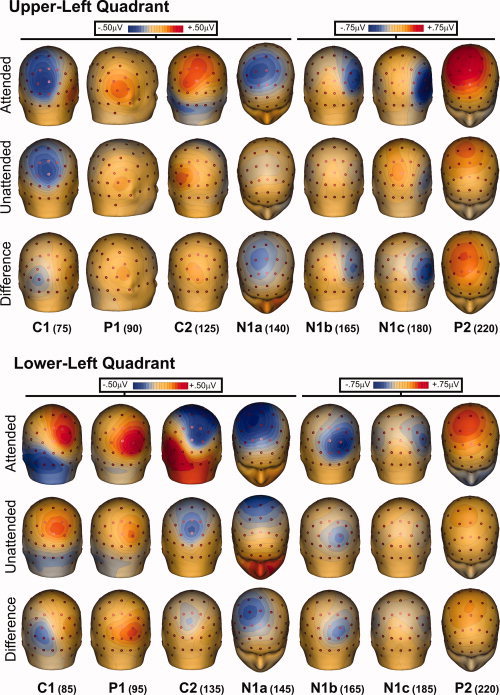
Figure 3.

Spline‐interpolated 3D voltage maps of the various components in the grand‐averaged waveforms for ERPs to stimuli in the left quadrants. Maps of each component are shown at the indicated latencies for attended, unattended, and difference (attended minus unattended) waveforms. [Color figure can be viewed in the online issue, which is available at wileyonlinelibrary.com.]
