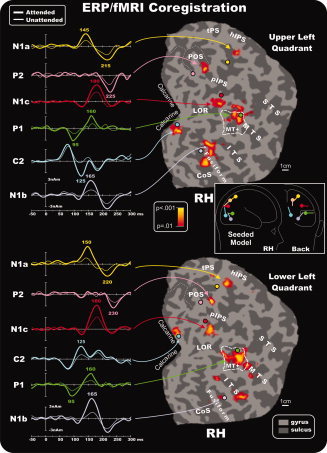
Figure 5.

Combination of the ERP/fMRI attention effects in the right hemisphere for contralateral stimuli in the upper and lower quadrants. The left panels show the source waveforms of the dipoles fit to the grand‐averaged ERPs and seeded to the fMRI activations indicated by arrows (listed in Table II). Right panels show group‐averaged contralateral fMRI activations superimposed on the flattened hemisphere (occipital lobe) of the MNI template. Circles indicate the locations of the dipoles in the unseeded model listed in Table III. The pseudocolor scale in the center of the figure indicates the statistical significance of the fMRI activations. Major sulci (dark gray) are labeled as follows: parieto‐occipital sulcus (POS), transverse segment of the parietal sulcus (tPS), intraparietal sulcus (IPS), superior temporal sulcus (STS), middle temporal sulcus (MTS), inferior temporal sulcus (ITS), lateral occipital region (LOR), fusiform gyrus (Fusiform), and calcarine fissure (Calcarine). The fundus of the POS is indicated by dashed lines. The dashed outline surrounding MT+ represents the group‐averaged location of the motion‐sensitive cortex based on separate localizer scans. Inset shows as an example the schematic representation of the source locations and orientations in the seeded dipole model of the upper left quadrant attention effect. Similar models were obtained for the other quadrants. [Color figure can be viewed in the online issue, which is available at wileyonlinelibrary.com.]
