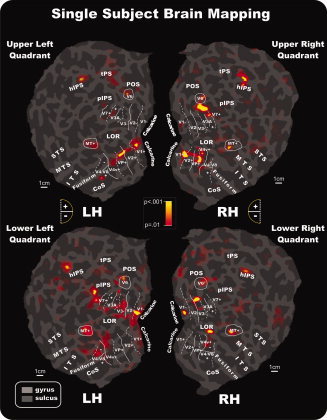
Figure 7.

Attention‐related fMRI activations projected onto the flattened left and right hemispheres of an individual participant. Activations in response to contralateral stimuli in each quadrant are shown in relation to the boundaries of visual areas defined in the same subject by the retinotopic visual field sign and by MT+ and V6 mapping. As indicated in the semicircular logos, dashed and solid lines correspond to vertical and horizontal meridians, respectively; the plus and minus symbols refer to upper and lower visual fields representations, respectively. Other labels and logos are as in Figures 5 and 6. [Color figure can be viewed in the online issue, which is available at wileyonlinelibrary.com.]
