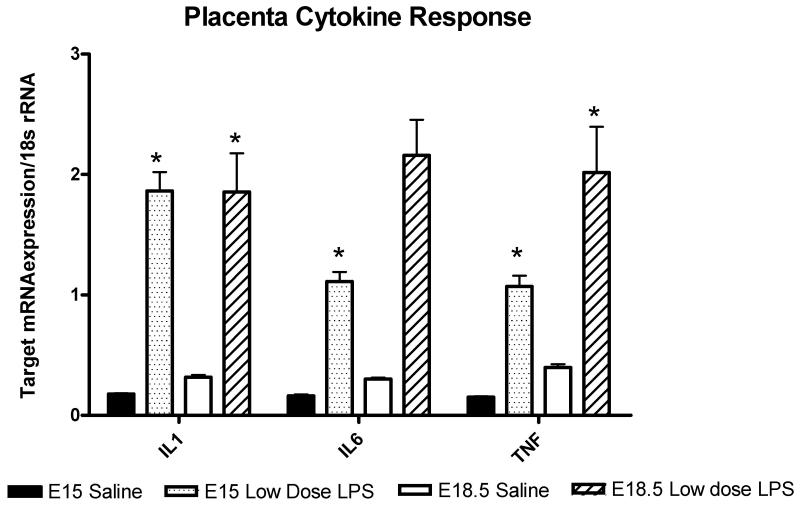
Figure 3.
Cytokine expression in the placenta. Bar graph representing mean mRNA expression normalized to the amount of 18s rRNA in placentas exposed to saline or low dose LPS at both gestational time points (E15 and E18.5). Exposure to low dose LPS increased placental IL1β 12-fold (*P=0.008) on E15 and 5.8-fold on E18.5 (*P=0.009). Low dose LPS increased IL6 mRNA expression 8.6-fold (P=0.008) on E15 and 87-fold (P=0.06) on E18.5. Low dose LPS increased TNF 7-fold (P=0.002) on E15 and 5-fold (P=0.04) on E18.5. MRNA expression was compared using T-test when data was normally distributed and Mann Whitney Rank Sum test when the data was non-parametric.

