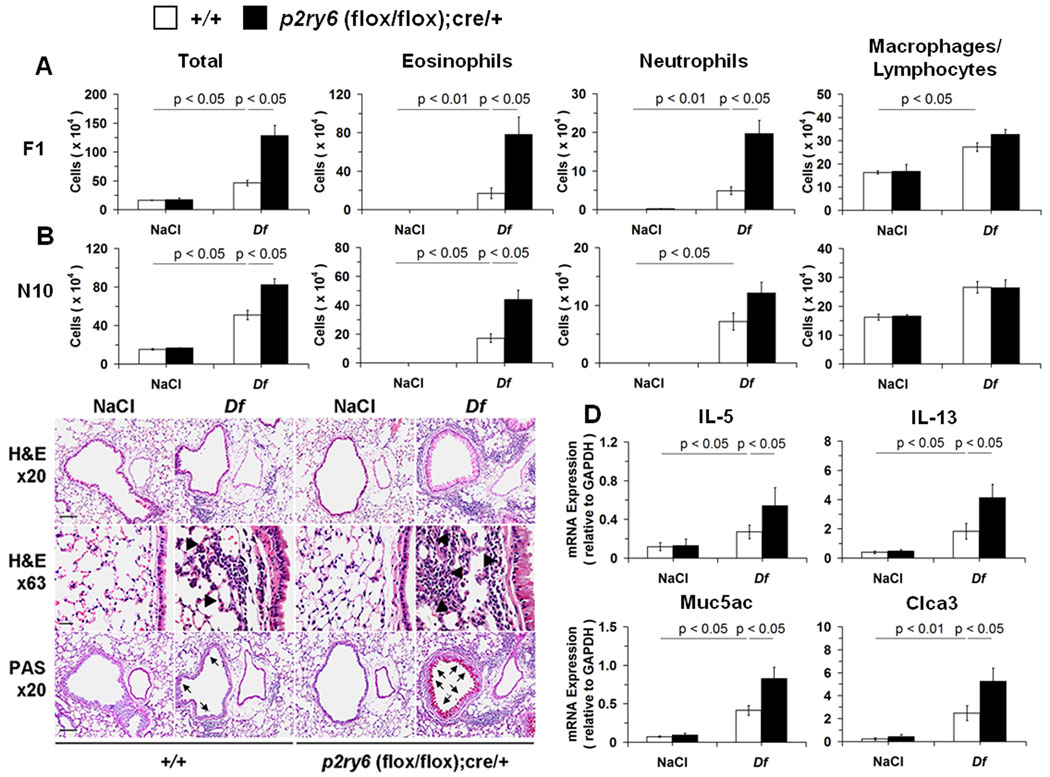
Figure 2. Df-induced pulmonary inflammation in NaCl- and Df-treated +/+ and p2ry6 (flox/flox); cre/+ mice.
(A) Total and differential cell counts from BAL fluid of NaCl-and Df-treated +/+ (open bars; n = 9 and 23, respectively) and p2ry6 (flox/flox); cre/+ (filled bars; n = 9 and 18) mice at the F1 stage of breeding. (B) Total and differential cell counts from BAL fluid of NaCl-and Df-treated C57BL/6 +/+ (open bars; n = 5 and 19, respectively) and p2ry6 (flox/flox); cre/+ (filled bars; n = 5 and 20) mice at the N10 stage. (C) Tissue sections of lung showing BVBs from NaCl- and Df-treated +/+ and p2ry6 (flox/flox);cre/+ mice were stained with hematoxylin-azue-2 eosin for assessing inflammatory cell infiltrates (H&E x20) and demonstrating tissue eosinophils (H&E x63, arrow heads) or by PAS reaction for depicting mucus-secreting cells (PAS x20, arrows). Scale bars, 100 (x20) or 25 (x63) µm. (D) Expression of mRNA encoding cytokines and mucus-associated proteins in the lung tissue of NaCl- and Df-treated +/+ (n = 6 and 18, respectively) and p2ry6 (flox/flox); cre/+ (n = 6 and 15) mice, measured by qPCR. Data are expressed as ratio of the indicated mRNA expression relative to GAPDH. Values are mean ± SEM from four (A) and three (B) independent experiments. Pictures in (C) are from one representative mouse per group from one of three independent experiments with similar results. Original magnifications, x20 and x63.

