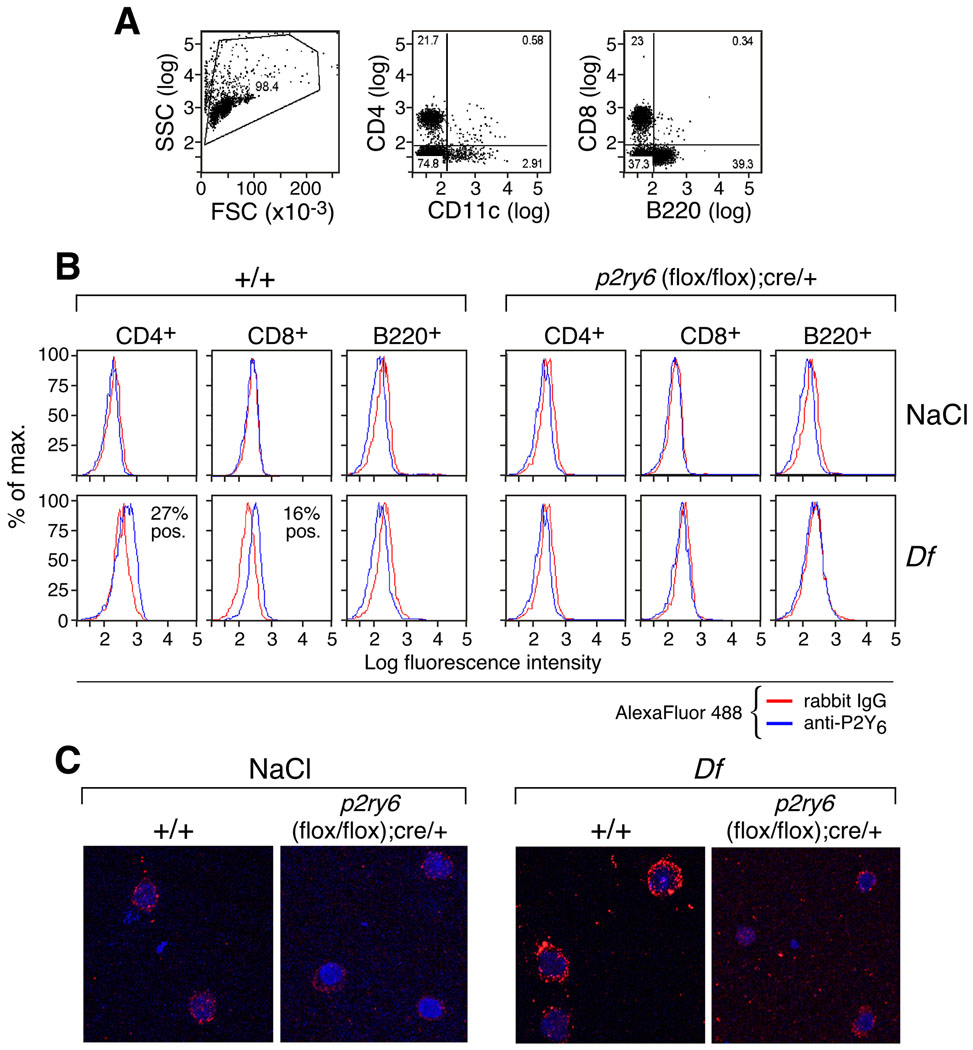
Figure 4. Cytofluorographic detection of P2Y6 receptors on PLN cell subsets.
(A) Dot plots showing the FSC/SSC gated cells and the analysis of the expression of CD4, CD11c, CD8, and B220 on PLN cells from Df-treated +/+ mice. Percentages of positive and negative cells are displayed. (B) Histograms showing the expression of P2Y6 receptors (blue lines) vs. isotype control (red lines) on CD4 +, CD8+, and B220+-gated PLN cells in NaCl- and Df-treated +/+ and p2ry6 (flox/flox);cre/+ mice. Percent positives are displayed. (C) Confocal images of CD4+ cells purified from the lungs of the indicated NaCl- or Df-challenged strains. Panels are from one experiment representative of two with similar results.

